Sequential test for ratio of two means
When comparing means of two non-negative random variables, we are often interested in the ratio of two means since the ratio does not depend on the scale of underlying distributions. A typical statistical test for the ratio of two means is based on either the ratio of two sample means or its logarithmic value.
For the fixed sample size case, by the delta method, the log ratio of two sample means can be approximated by a normal distribution. Therefore, we can build an asymptotically valid z-test or t-test for a large enough fixed sample size. Since the log ratio can be approximated by a normal distribution, it is natural to ask whether the sequential normal test can be applied to the sequence of logs of ratios too.
From the author’s best knowledge, the validity of the normal approximation in the sequential testing setup is not yet fully understood. As a practitioner, in this post, we simulate the type-1 error of the sequential normal test to examine whether we may practically use the sequential normal test to continuously monitor the ratio of two means.
Specifically, we will use a naive plug-in method of the following steps:
- Estimate the variance of the log ratio of two sample means via the grouped jackknife method.
- Naively treat the log ratio of sample means as an observed sample mean and apply a normal sequential test by plugging-in the variance estimate from the previous step.
Before diving into the sequential test simulation, let’s first review the fixed sample size case.
Asymptotic distribution of log ratio of two sample means
group_jackknife_variance_estimator <- function(x_vec, y_vec, group_size = 20) {
  group_sum_helper <- function(vec, group_ind) {
    sum(vec[seq_along(vec) %% group_size == group_ind])
  }
  x_grouped_sum <- sapply(seq(0, group_size - 1), group_sum_helper, vec = x_vec)
  y_grouped_sum <- sapply(seq(0, group_size - 1), group_sum_helper, vec = y_vec)

  x_sum <- sum(x_vec)
  y_sum <- sum(y_vec)

  log_total_ratio <- log(y_sum / x_sum)

  loo_ratio_vec <- (y_sum - y_grouped_sum) / (x_sum - x_grouped_sum)
  loo_log_ratio_vec <- log(loo_ratio_vec)

  return(var(group_size * log_total_ratio - (group_size-1) * loo_log_ratio_vec) / (group_size))
}

group_jackknife_bias_corrected_estimator <- function(x_vec, y_vec, group_size = 20) {
  group_sum_helper <- function(vec, group_ind) {
    sum(vec[seq_along(vec) %% group_size == group_ind])
  }
  x_grouped_sum <- sapply(seq(0, group_size - 1), group_sum_helper, vec = x_vec)
  y_grouped_sum <- sapply(seq(0, group_size - 1), group_sum_helper, vec = y_vec)

  x_sum <- sum(x_vec)
  y_sum <- sum(y_vec)

  log_total_ratio <- log(y_sum / x_sum)

  loo_ratio_vec <- (y_sum - y_grouped_sum) / (x_sum - x_grouped_sum)
  loo_log_ratio_vec <- log(loo_ratio_vec)

  return(group_size * log_total_ratio - (group_size - 1) * mean(loo_log_ratio_vec))
}

fixed_size_simulator <- function(n, sig_x, sig_y, group_size = 20) {
  # We use log normal distribution logNormal(0, sig^2) for each group.
  x_vec <- exp(rnorm(n, 0, sig_x))
  y_vec <- exp(rnorm(n, 0, sig_y))

  log_sample_ratio <- log(sum(y_vec) / sum(x_vec))
  bias_corrected <- group_jackknife_bias_corrected_estimator(x_vec, y_vec, group_size)
  variance_estimate <- group_jackknife_variance_estimator(x_vec, y_vec, group_size)

  out <- c(
    log_sample_ratio = log_sample_ratio,
    bias_corrected = bias_corrected,
    variance_estimate = variance_estimate
  )

  return(out)
}

sequential_simulator <- function(n, sig_x, sig_y, group_size = 20) {
  # We use log normal distribution logNormal(0, sig^2) for each group.
  x_vec <- exp(rnorm(n, 0, sig_x))
  y_vec <- exp(rnorm(n, 0, sig_y))

  # Compute a sequence of logs of ratios of sample means and their variances.
  log_sample_ratio_vec <- log(cumsum(y_vec) / cumsum(x_vec))
  variance_estimator <- function(i) {
    return(group_jackknife_variance_estimator(x_vec[1:i], y_vec[1:i], group_size))
  }

  variance_estimate_vec <- sapply(seq_along(x_vec), variance_estimator)


  bias_corrected_estimator <- function(i) {
    return( group_jackknife_bias_corrected_estimator(x_vec[1:i], y_vec[1:i], group_size))
  }

  bias_corrected_vec <- sapply(seq_along(x_vec), bias_corrected_estimator)

  out <- data.frame(
    log_sample_ratio = log_sample_ratio_vec,
    bias_corrected = bias_corrected_vec,
    variance_estimate = variance_estimate_vec
  )

  return(out)
}
set.seed(100)
alpha <- 0.05
n_fixed <- 200
b <- 1000
sig_x <- 1/2
sig_y <- sig_x
group_size <- 20
fixed_runs <- replicate(b, fixed_size_simulator(n_fixed, sig_x, sig_y, group_size = group_size))
m_vec <- fixed_runs["log_sample_ratio", ]
b_vec <- fixed_runs["bias_corrected",]
s_vec <- sqrt(fixed_runs["variance_estimate",])
hist(m_vec / s_vec, breaks = 20, prob=TRUE,
main = "Distribution of log ratio of sample means",
xlab = "log ratio of sample mean",
ylim = c(0,0.4), xlim = c(-4,4))
curve(dnorm(x, mean=0, sd=1),
col="darkblue", lwd=2, add=TRUE, yaxt="n")
curve(dt(x, df = group_size - 1),
col="darkred", lwd=2, add=TRUE, yaxt="n")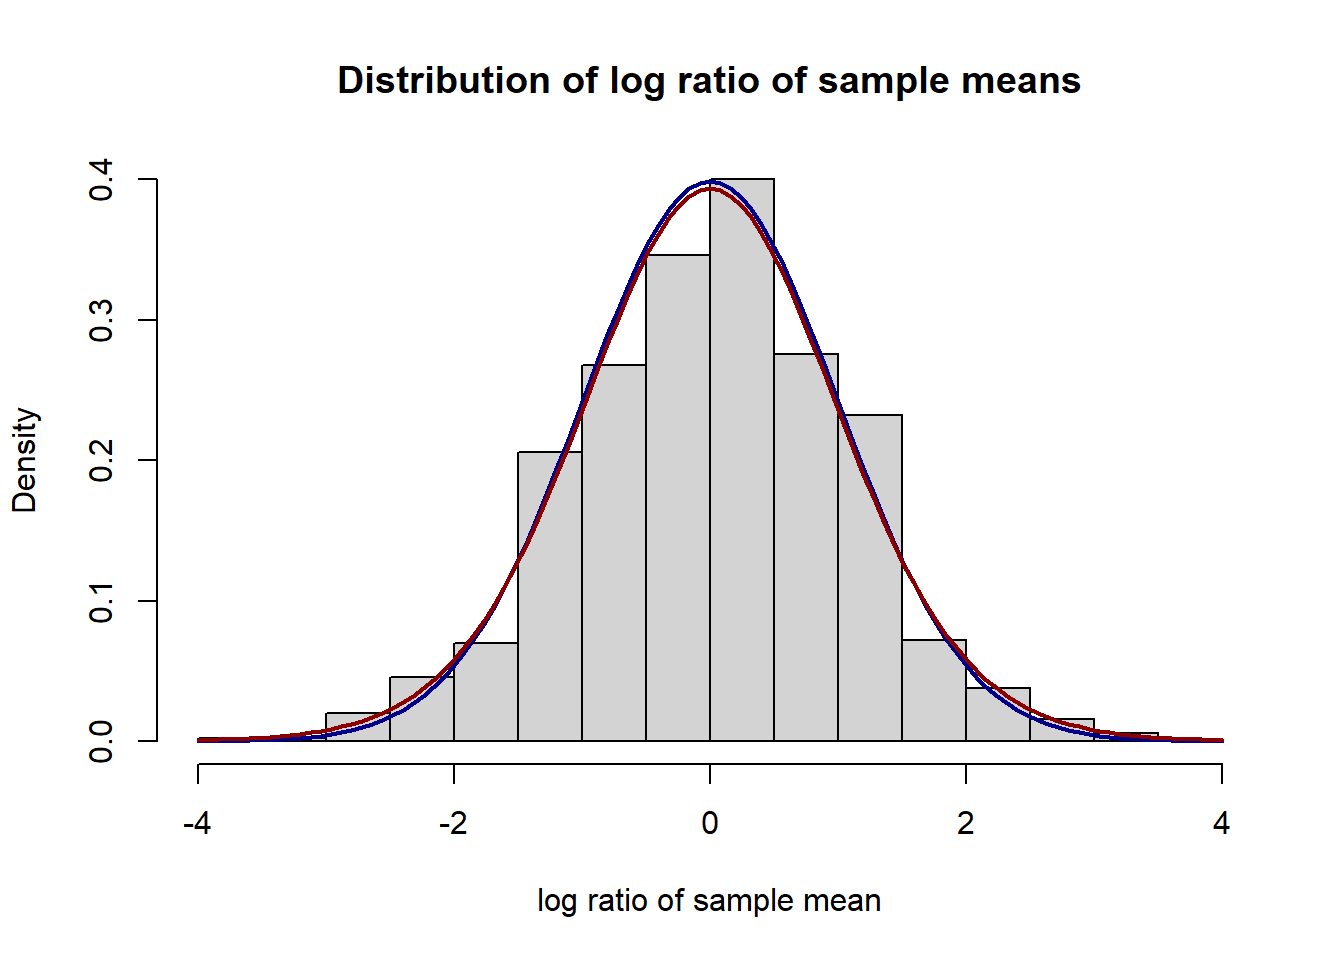
hist(b_vec / s_vec, breaks = 20, prob=TRUE,
main = "Distribution of bias-corrected estimates",
xlab = " bias-corrected estimates",
ylim = c(0,0.4), xlim = c(-4,4))
curve(dnorm(x, mean=0, sd=1),
col="darkblue", lwd=2, add=TRUE, yaxt="n")
curve(dt(x, df = group_size - 1),
col="darkred", lwd=2, add=TRUE, yaxt="n")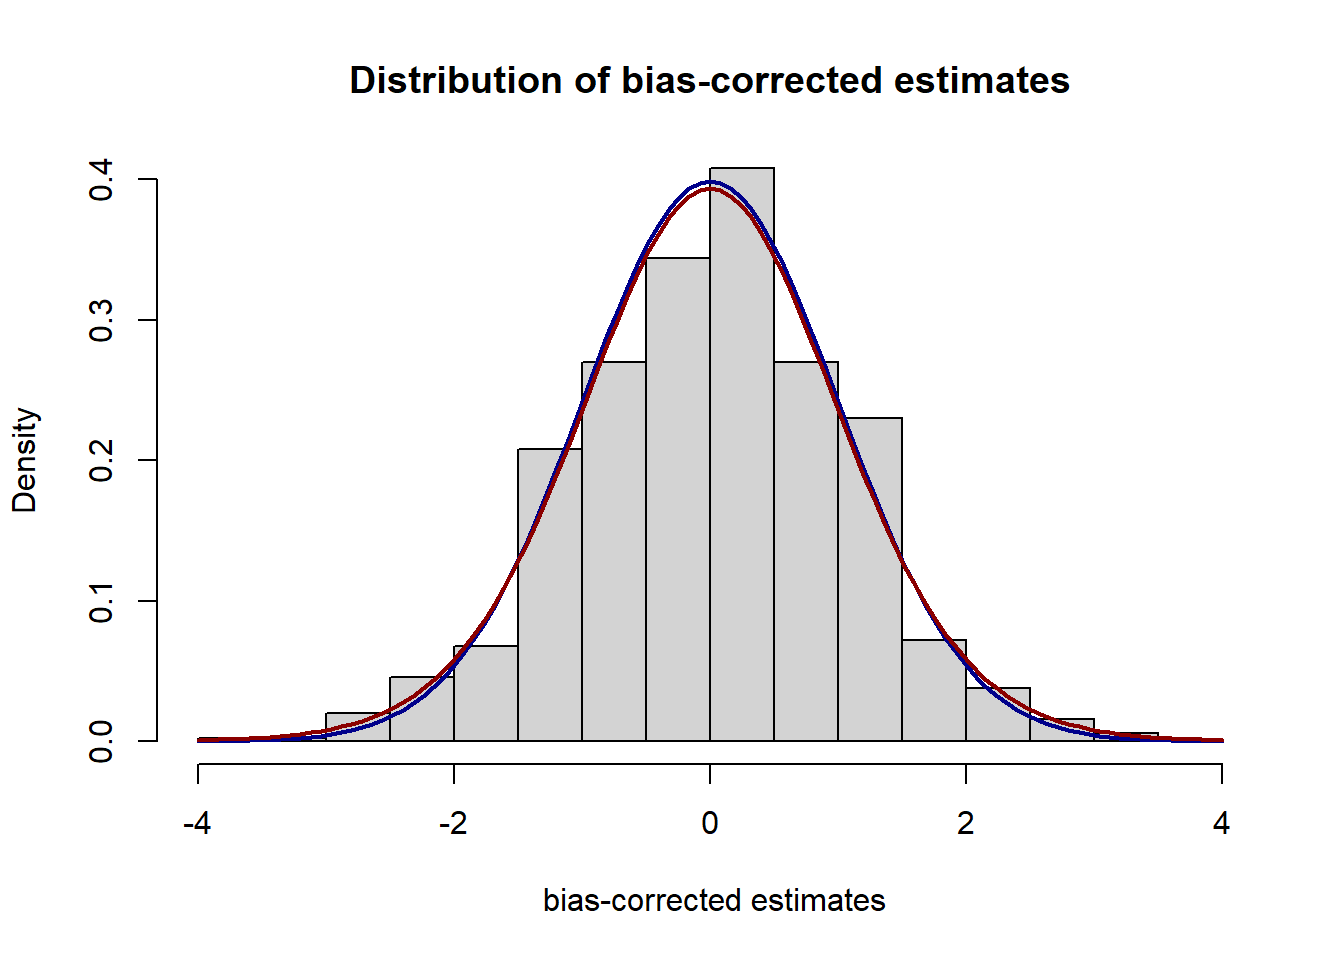 In this simulation study, we generate two independent and identical groups of samples from the log normal distribution, logNormal(0, 1/2^2) of the size 200.
We repeat this simulation run for 1000 times.
In this simulation study, we generate two independent and identical groups of samples from the log normal distribution, logNormal(0, 1/2^2) of the size 200.
We repeat this simulation run for 1000 times.
Above, we plot histograms of simulated log ratios and their bias-corrected estimates normalized by the grouped Jackknife variance estimates with the group size of 20. The blue line corresponds to the density of the standard normal distribution and the red line is for the t-distribution with 19 degree of freedom. We can see the log ratio and its bias-corrected estimates are well-approximated by normal and t-distributions.
T-test for a fixed sample size
t_alpha_over_2 <- qt(1-alpha / 2, df = group_size - 1)

t_test <- function(m, s, alpha = 0.05){
  t_value <- m/s
  is_rejected <- abs(t_value) > t_alpha_over_2
  return(ifelse(is.na(is_rejected), FALSE, is_rejected))
}

t_test_result <- t_test(b_vec, s_vec)

print("Type-1 error is")
## [1] "Type-1 error is"print(mean(t_test_result))## [1] 0.058Here, we run fixed sample size t-test of level 0.05 for 1000 times. As expected, t-test with Jackknife estimates controls the type-1 error at the target level within the simulation error bound.
T-test cannot be used for a sequential setup.
n <- 500
sequential_runs <- replicate(b, sequential_simulator(n, sig_x, sig_y, group_size = group_size))

m_list <- sequential_runs["log_sample_ratio",]
b_list <- sequential_runs["bias_corrected",]
s_list <- lapply(sequential_runs["variance_estimate",], sqrt)

seq_t_test_for_each_run <- function(ind, alpha = 0.05) {
  return(any(t_test(b_list[[ind]], s_list[[ind]], alpha)))
}

seq_t_test_result <- sapply(1:b, seq_t_test_for_each_run, alpha = alpha)

print("Type-1 error is")
## [1] "Type-1 error is"print(mean(seq_t_test_result))## [1] 0.635As same as the usual t-test, if we run t-test sequentially whenever a new data comes, type-1 error of the test significantly will be inflated and no longer control the error at the target level. Usually, sequential test is designed to run indefinitely and, from the law of the iterated logarithm, we know the type-1 error will go up to 1 eventually. As a demonstration, we only run the t-test sequentially up to 500 samples. However, at n = 500, the type-1 error already reached at 0.635, which is significantly higher than the target level 0.05.
Sequential normal test with Jackknife variance estimate.
library(stcpR6)

log_ratio_lower <- 0.01
log_ratio_upper <- 0.2

st_normal <- stcpR6::Stcp$new(
  method = "ST",
  family = "Normal",
  alternative = "two.sided",
  threshold = log(1/alpha), # level alpha test
  m_pre = 0,  # Null: log ratio = 0
  delta_lower = log_ratio_lower, # Lower bound of the size of log ratio
  delta_upper = log_ratio_upper  # Upper bound of the size of log ratio
)

# Note the upper and low bounds do not affect the validity of the testing procedure.
# It only affects the sample efficiency under the alternative.

st_normal_test_for_each_run <- function(ind, alpha = 0.05) {

  # We start the test after group_size samples.

  # 1/variance estimates.
  n_cumsum <- (1/s_list[[ind]]^2)[-seq(1,group_size)]
  # Get an incremental 1/variance estimate of each time by taking the diff
  n_vec <- c(n_cumsum[1], n_cumsum[-1] - n_cumsum[-length(n_cumsum)])
  # Set 0 if we have no meaningful variance estimate.
  n_vec[is.nan(n_vec)|is.na(n_vec)] <- 0

  # Get cumulative sum process by multiplying bias-corrected estimates and 1/variances.
  s_cumsum <- b_list[[ind]][-seq(1,group_size)] * n_cumsum
  # Get an incremental sum process.
  s_vec <- c(s_cumsum[1], s_cumsum[-1] - s_cumsum[-length(s_cumsum)])
  # Compute the normalized incremental process.
  b_vec <- s_vec / n_vec
  # Set 0 if we have no meaningful estimate.
  b_vec[is.nan(b_vec)|is.na(b_vec)] <- 0

  # Initialize stcp object to start sequential test
  st_normal$reset()
  # Run the sequential test by naively treating
  # the normalized incremental process as sample mean
  # and the 1/variance process as the true 1/variance process.
  st_normal$updateLogValuesUntilStopByAvgs(
    x_bars = b_vec,
    ns = n_vec
  )

  return(st_normal$isStopped())
}

st_normal_test_result <- sapply(1:b,
                                st_normal_test_for_each_run,
                                alpha)

print("Type-1 error is")
## [1] "Type-1 error is"print(mean(st_normal_test_result))## [1] 0.049To evaluate the type-1 error of the sequential normal test with variance estimates, we used stcpR6 package supporting various sequential testing and change-point detection algorithms. In this simulation, we use the sequential normal test setup designed to detect log ratio of two means with the size between [0.01, 0.2] effectively under the alternative.
Originally, this sequential test object is designed to take the sample mean and the reciprocal of its true variance at each time to decide whether it should reject the null or not. Instead, in this simulation, we put the bias-corrected estimate and the reciprocal of the estimated variance as naive proxies.
Unlike the t-test example above, this sequential normal test with Jackknife variance estimate results in the type-1 error of 0.049, which is under the target level within the simulation error bound after 500 samples. It would be interesting to see whether the type-1 error keep remaining below the target level as the number of sample size increase but for the sake of time, we only run the simulation up to 500 samples.
Comparison of powers of tests
set.seed(100)
sig_x <- 1/2
sig_y_under_h1 <- 1/10

fixed_runs_under_h1 <- replicate(b, fixed_size_simulator(
  n_fixed,
  sig_x,
  sig_y_under_h1,
  group_size))

b_vec_under_h1 <- fixed_runs_under_h1["bias_corrected",]
s_vec_under_h1 <- sqrt(fixed_runs_under_h1["variance_estimate",])
So far, we study the validity of t-test and sequential normal test for log ratio of two means via simulations. Especially, we checked that the sequential normal test with Jackknife bias-corrected estimates and variance estimates seems to control the type-1 error, at least in this specific simulation setup.
t_test_result_under_h1 <- t_test(b_vec_under_h1, s_vec_under_h1)

print("Power of the t-test is")
## [1] "Power of the t-test is"print(mean(t_test_result_under_h1))## [1] 0.846Now, it is natural to ask whether the sequential normal test is sample-efficient under alternatives. As a reference, we simulate the power of the fixed sample size t-test. For the alternative scenario, We picked logNormal(0, 1/2^2) and logNormal(0, 1/10^2) distributions and compared log ratio of two means. The true log ratio of two means is given by -0.12. With the fixed sample size of 200, the power of the fixed sample t-test is given by 0.846.
sequential_runs_under_h1 <- replicate(b, sequential_simulator(n, sig_x, sig_y_under_h1, group_size = group_size))

b_list_under_h1 <- sequential_runs_under_h1["bias_corrected",]
s_list_under_h1 <- lapply(sequential_runs_under_h1["variance_estimate",], sqrt)
For the sequential normal case, ideally, we need to run the each simulation until the null hypothesis is rejected since the sequential test is designed to be a power of 1 test, and its efficiency is measured by the expected stopping time under the alternative.
st_normal <- stcpR6::Stcp$new(
  method = "ST",
  family = "Normal",
  alternative = "two.sided",
  threshold = log(1/alpha), # level alpha test
  m_pre = 0,  # Null: log ratio = 0
  delta_lower = log_ratio_lower, # Lower bound of the size of log ratio
  delta_upper = log_ratio_upper  # Upper bound of the size of log ratio
)

st_normal_test_for_each_run_under_h1 <- function(ind, alpha = 0.05) {

  # We start the test after group_size samples.

  # 1/variance estimates.
  n_cumsum <- (1/s_list_under_h1[[ind]]^2)[-seq(1,group_size)]
  # Get an incremental 1/variance estimate of each time by taking the diff
  n_vec <- c(n_cumsum[1], n_cumsum[-1] - n_cumsum[-length(n_cumsum)])
  # Set 0 if we have no meaningful variance estimate.
  n_vec[is.nan(n_vec)|is.na(n_vec)] <- 0

  # Get cumulative sum process by multiplying bias-corrected estimates and 1/variances.
  s_cumsum <- b_list_under_h1[[ind]][-seq(1,group_size)] * n_cumsum
  # Get an incremental sum process.
  s_vec <- c(s_cumsum[1], s_cumsum[-1] - s_cumsum[-length(s_cumsum)])
  # Compute the normalized incremental process.
  b_vec <- s_vec / n_vec
  # Set 0 if we have no meaningful estimate.
  b_vec[is.nan(b_vec)|is.na(b_vec)] <- 0

  # Initialize stcp object to start sequential test
  st_normal$reset()
  # Run the sequential test by naively treating
  # the normalized incremental process as sample mean
  # and the 1/variance process as the true 1/variance process.
  st_normal$updateLogValuesUntilStopByAvgs(
    x_bars = b_vec,
    ns = n_vec
  )

  stopped_time <- which(abs(st_normal$getStoppedTime() - n_cumsum) < 1e-8)

  return(c(
    stopped_time = ifelse(length(stopped_time) == 0, n, max(stopped_time) + group_size),
    is_stopped = st_normal$isStopped()
    )
  )
}


st_normal_test_result_under_h1  <- sapply(1:b,
                                          st_normal_test_for_each_run_under_h1,
                                          alpha)
stopped_time <- st_normal_test_result_under_h1["stopped_time", ]
is_stopped <- st_normal_test_result_under_h1["is_stopped", ]
print("Power of the test and average stopped time are")
## [1] "Power of the test and average stopped time are"print(c(mean(is_stopped), mean(stopped_time)))## [1] 0.985 181.394For the sake of simple simulation, we run the each simulation only up to 500 samples as same as the previous type-1 error simulation case. Then, we measure both the power of the sequential normal test up to the horizon 500 and the average of the stopped time. From the simulation, we observed that the sequential normal test achieved a 16.43% higher power 0.98 while the average of the stopped time 181.39 is -9.3 % lower then the fixed sample size 200 of the previous t-test simulation.
Conclusion
In this post, we reviewed the validity and effectiveness of the fixed sample size t-test for testing log ratio of two means via grouped Jackknife estimates. Then we explored whether we can use the sequential normal test with grouped Jackknife estimates to build a valid and effective sequential testing process. Although there is no formal proof of the validity, the simulation showed, at least for this logNormal two sample testing case, the sequential normal test resulted in a valid type-1 error control and yielded a high power and sample efficiency under the alternative.
Jaehyeok Shin
Data Scientist
Interested in understanding the sequential and adaptive nature of data analysis.